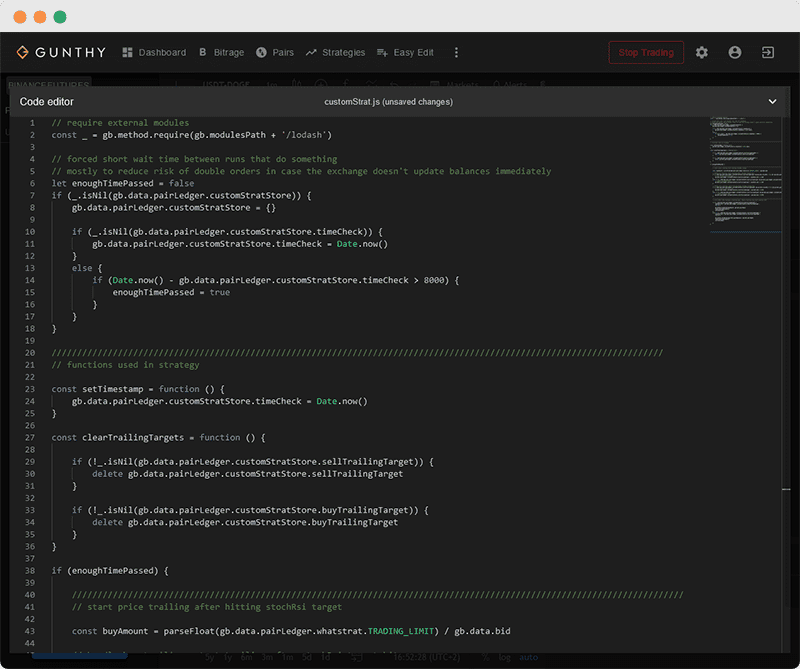
Easy access to market data and trading methods
Run custom JS trading strategies
Got very specific ideas about trading strategies? Gunbot supports custom trading strategies in JavaScript, you can bring your own modules.

Run custom strategy code
Deploy on many exchanges
Gunbot supports lots of different exchanges and makes market data and trading methods available to your strategy. Easily deploy your strategy on many exchanges.
No special syntax
A custom strategy is just simple JavaScript. You don't need to learn a new language to start coding trading strategies. Async and other modern JS code is supported.
Bring your own modules
Need NPM module X for your strategy? No problem, you can install external JS modules and use them in your strategy code. Computing resource usage is only limited by your hardware.
Preset options are not for everyone
Why use custom JS strategies
Gunbot comes packed with hundreds of configurable strategy options. These options can be used for great trading strategies, but not every imaginable scenario can be handled with preset options.
Custom strategies give you full freedom. For example a preset strategy option might give the option to trigger an order when RSI is above or below X, with a custom strategy you could additionally do a lookback of x periods, or calculate the slope RSI is drawing.
By default Gunbot calculates about 20 different indicators for its built in strategies. But of course there are many more indicators out there. In a custom strategy you can use exactly the indicators you need, and often NPM will have a ready made module for it.
Want to use alternative data sources next to data coming from the exchange directly? Now you can.
// collect indicator data
let rsi10
let rsi20
gb.method.tulind.indicators.rsi.indicator([gb.data.candlesClose], [10], function (err, results) {
    rsi10 = results[0]
});
gb.method.tulind.indicators.rsi.indicator([gb.data.candlesClose], [20], function (err, results) {
    rsi20 = results[0]
});

// define trading conditions
const entryConditions = (
    rsi10[rsi10.length - 1] > rsi20[rsi20.length - 1] &&
    rsi10[rsi10.length - 2] < rsi20[rsi20.length - 2]
)
const exitConditions = (
    gb.data.gotBag &&
    rsi10[rsi10.length - 1] < rsi20[rsi20.length - 1] &&
    rsi10[rsi10.length - 2] > rsi20[rsi20.length - 2]
)

// place orders when trading conditions happen
const buyAmount = parseFloat(gb.data.pairLedger.whatstrat.TRADING_LIMIT) / gb.data.bid

if (entryConditions) {
    gb.method.buyMarket(buyAmount, gb.data.pairName)
}
else if (exitConditions) {
    gb.method.sellMarket(gb.data.quoteBalance, gb.data.pairName)
}
Code example
Dual RSI strat
This example shows how you can create a simple trading strategy. The strategy places a market buy order when a 10 period RSI crosses over a 20 period RSI, and places a market sell order on the crossdown. First you would generate your RSI data, once for a 10 period and once for a 20 period RSI. This is done using the tulind library, but you could use any method you want. Often you could use pre calculated indicator values, but in this case we need the full array to detect crosses. Then the crossing conditions are defined, when these happen an order gets sent.
